Data Viz Library
Pioneering Data Visualization Library for Figma

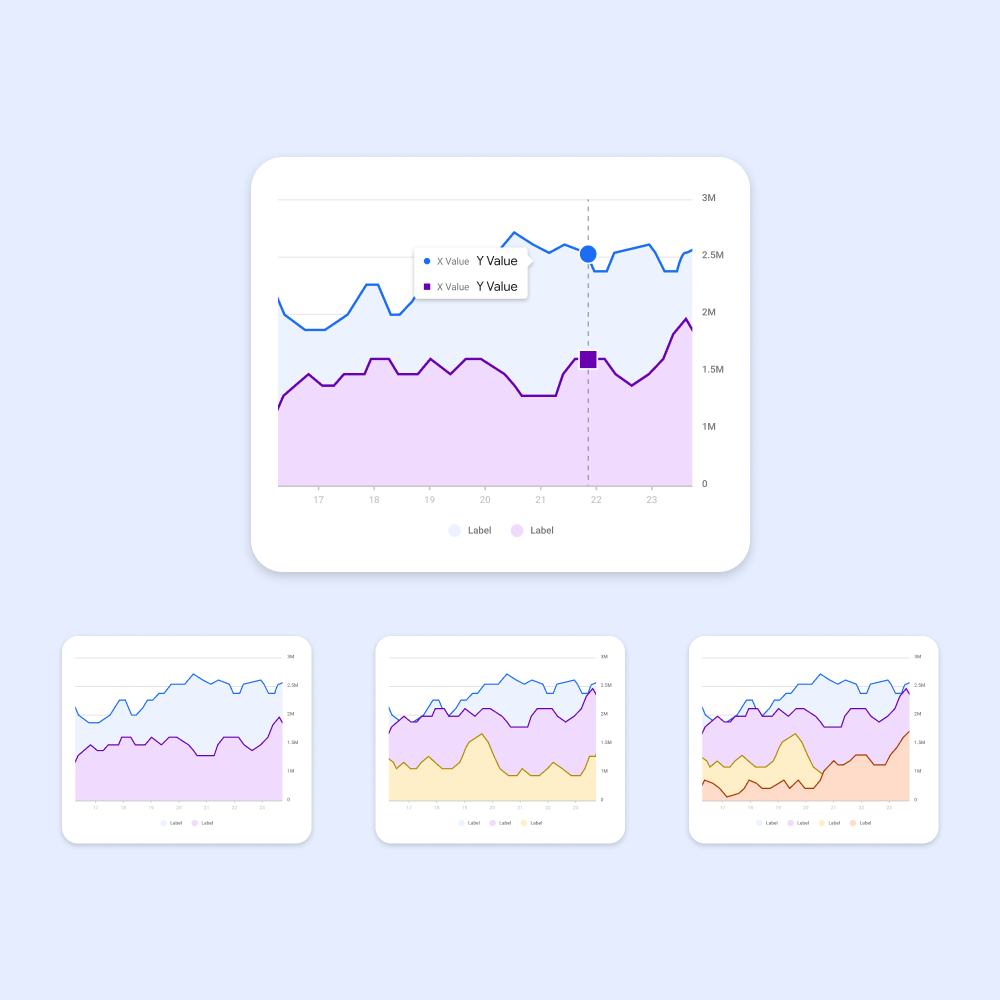
This project aimed to create a comprehensive Figma library for data visualization, going beyond the typical collection of graphs. With a whopping 144 components comprised of 432 variants in total, representing 36 different subtypes of data visualization, this library provides the building blocks for an incredible +20,000 possible graphs. We focused on empowering designers and non-designers with eight essential data visualization types, all designed for seamless plug-and-play use.


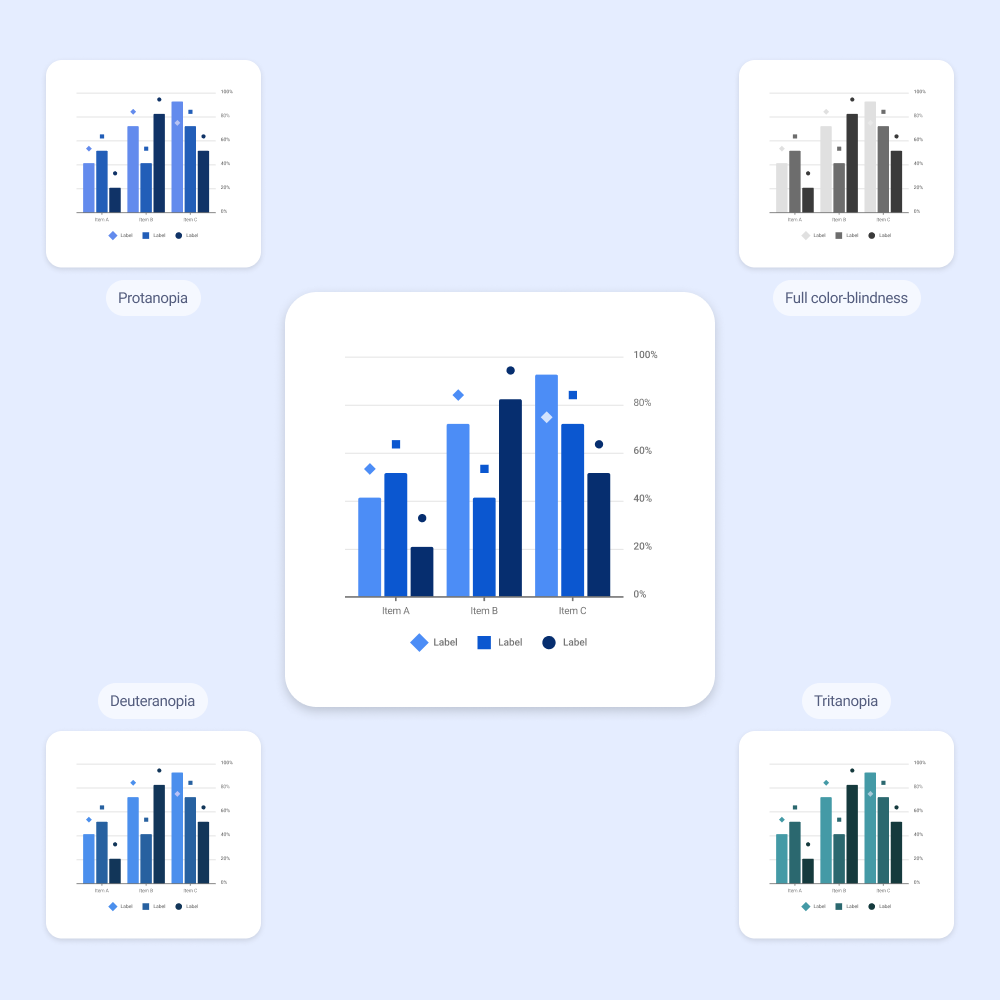
Recognizing the diverse needs of users, we built the library with extensive customization options. This flexibility allows users to tailor the visualizations to their specific data and branding requirements. Accessibility was paramount, with a focus on color contrast that considered various colorblindness types to ensure clear information for all viewers. We also prioritized maintaining data visibility during interactions, making sure the graphs remained informative when users engaged with them.

Understanding that data visualizations can be used across various devices, we ensured all components were fully responsive. Figma's functionalities for resizing shapes can have limitations, but through innovative techniques (e.g., leveraging auto layout and constraints effectively), we overcame these obstacles. This guarantees users can confidently present their data flawlessly on desktops, mobiles, and screens of all sizes.
Want to know more?
There is so much more I can say about this project! Sadly, much of the information is private and needs to be protected... If you wanna dig deeper, feel free to contact me and we can arrange an interview :)